
U.S. Hotel Performance Q3 2024: Key Metrics, Transactions, and Market Trends
- Posted by admin
- On January 3, 2025
- 0 Comments
The U.S. Hotel performance in Q3 2024 got off to a slower pace, attributed to the 4th of July holiday week. However, the national hotel performance stabilized shortly thereafter because of leisure & business travel demand coupled with natural calamities like Hurricane Beryl & the associated tornados in Texas, Louisiana, Arkansas, Mississippi, Indiana, Kentucky, and New York, among others. Other chief contributors to a relatively stable performance in Q3 2024 were events like the United Nations General Assembly, Dreamforce 2024, and various concerts in the major U.S. markets.
Occupancy was reported at 61.30% at the start of Q3 2024, which increased to 68.40% at the end of Q3 2024. ADR was $157.27 at the beginning of Q3 2024, which increased to $170.24 by the end of Q3 2024. RevPAR was $96.35 at the start of Q3 2024, which increased to $116.50 at the end of Q3 2024
(Source: STR)
Analytical Summary


Major Q3 2024 transactions (By Sale Price)
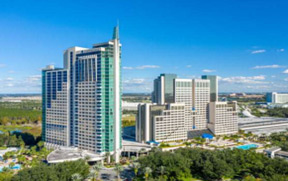
| 1. Hotel Name: Hyatt Regency Orlando Location: Orlando, FL No. of rooms: 1,641 Sale Price: $1,100,000,000 Price per unit: $670,323 per unit Seller: Hyatt Hotels Corporation Buyer: Ares Management Corp |
 |
| 2. Hotel Name: The Ritz-Carlton O’ahu, Turtle Bay Location: Kahuku, HI No. of rooms: 463 Sale Price: $680,000,000 Price per unit: $1,468,683 per unit Seller: Blackstone Inc. Buyer: Host Hotels & Resorts, Inc. |
 |
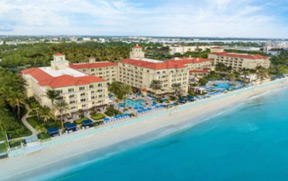
| 3. Hotel Name: Eau Palm Beach Resort & Spa Location: Lantana, FL No. of rooms: 309 Sale Price: $317,000,000 Price per unit: $1,025,889 per unit Seller: Blue Coast Capital, Inc. Buyer: Lawrence Investments, LLC |
 |
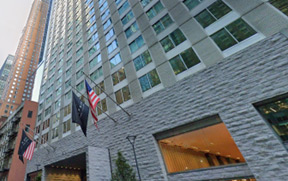
| 4. Hotel Name: Thompson Central Park, New York Location: New York, NY No. of rooms: 587 Sale Price: $308,000,000 Price per unit: $524,702 per unit Seller: Elliott Management Corp Buyer: Gencom |
 |
(Source: CoStar)
Q3 2024 Cap Rates
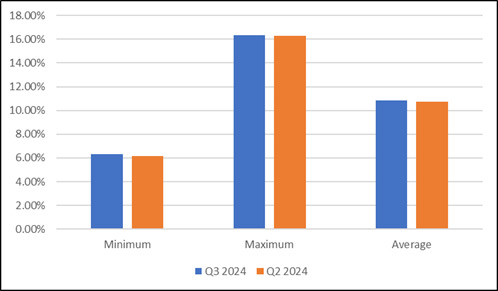
Average cap rates for U.S. hotels increased by 12 basis points in Q3 2024 as compared to Q2 2024. The following table illustrates minimum, maximum and average cap rates for U.S. hotels in Q3 2024 & Q2 2024. (Source: RealtyRates.com)
| Cap Rate | Q3 2024 | Q2 2024 | Difference (bps) |
| Minimum | 6.31% | 6.18% | 13 |
| Maximum | 16.34% | 16.30% | 4 |
| Average | 10.87% | 10.75% | 12 |
Source: RealtyRates.com
Outlook
Hotel capitalization rate forecasts have been gradually increasing but are expected to peak in mid-to-late 2025. Historically, hotel capitalization rates were 100 to 150 basis points higher than office capitalization rates. This margin continued to shrink recently, and the forecast suggests that office capitalization rates will rise and peak in 25Q2. On the limited-service side, we hear from brokers that a change in ownership will likely trigger a renovation for those, i.e., most hotels that are well behind in their PIPs, roughly doubling the price per room of the expected sales price. This will make some deals infeasible.





0 Comments